Total Quality Management
Q1. What is QFD (Quality Function Deployment)?
ANS: Quality function deployment is an effective system for collecting customer input and factoring that input into the design process. Building affinity diagrams is an effective method for organizing customer feedback data so that it can be used to make ongoing design improvements. QFD allows for the systematic incorporation of customer needs, production capabilities and capacity, and all other relevant parameters into product development. QFD consists of the following basic activities:
-
Deployment of customer requirements (quality needs)
-
Deployment of measurable quality characteristics
-
Determination of the correlation between quality needs and characteristics
-
Assignment of numerical values to each quality characteristic
-
Integration of quality characteristics into the product
-
Detailed design, production, and quality control of the product
Q2. Explain the WHATs in a QFD matrix.
ANS: Gathering Customer Needs Input. The premise of QFD is that before any product or service is designed, the producer should have a good understanding of his potential customers’ needs in order to improve the likelihood that the product or service will be a market success. That the producer should be aware of customer needs seems logical, but it sounds far easier than it is. Before the textbook rework is started, the QFD team must work diligently to determine what potential customers would like to see in terms of attributes and features of the product—and perhaps—what they don’t like about our current product.
Refining the Customer Needs Inputs. Once the cross-functional QFD team has assembled sufficient information on what characteristics, attributes and features customers say they need, the information must be distilled into something useful. The data must be sorted into a prioritized set of the most important customer needs. At this point we will call on some QFD Tools, the first of which is theAffinity Diagram. Refining a large collection of data into something that represents the essence of the VOC is done through the analysis techniques of the affinity diagram, and QFD team discussion.
Q3. Explain the HOWs in a QFD matrix.
ANS: The Technical Requirements room of the HOQ states how the company intends to respond to each of the Customer Needs. It is sometimes referred to as the voice of the company. We must state at the outset that the technical requirements are notthe design specifications of the product or service. Rather, they are characteristics and features of a product that is perceived as meeting the customer needs. They are measurable in terms of satisfactory achievement. Some may be measured by weight, strength, speed, and so on. Others by a simple yes or no, for example a desired feature, appearance, test, or material is or is not incorporated. The other side of the coin is that the technical requirements must not be limiting, but must be flexible enough to allow the company to consider every creative possibility in its attempts to satisfy the need.
Q4. Explain the 1, or 3, or 9 interrelationship values in a QFD matrix.
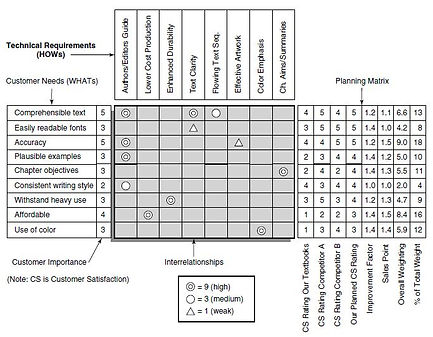
ANS: Now that we have the QFD team’s technical requirements (HOWs) in the HOQ, the next step is to examine how they relate to the WHATs of the Customer Needs. The results will be shown in the Interrelationships matrix, which links the HOWs and the WHATs. At each intersection cell of the interrelationship matrix the team must assess the degree of relationship between the WHAT and the corresponding HOW. This is usually done using scales of significance of 1 to 5 or 1 to 9, with the higher number indicating a stronger relationship. Sometimes these numbers are entered, but often symbols are used. For our example we will use symbols as follows:
Q5. Explain how you calculate the technical priorities in the design target matrix.
ANS: To determine the relative importance, or priorities, of each of the stated Technical Requirements (HOWs) in meeting the Customer Needs (WANTs), the QFD team simply multiplies each of the interrelationship ratings of the technical requirement (0, 1, 3, or 9) from the Interrelationship matrix, times the corresponding customer need’s Overall Weighting value in the Planning matrix; and then sums the columns. All of the data for these calculations are already in the HOQ of Figure 9. Starting with the technical requirement for a new and responsive set of Authoring/Editing Guidelines, we find that its relationship to the customer need for a Comprehensible Text was indicated in the Interrelationshipmatrix as a 9. Looking across the row to the Overall Weighting column of thePlanning matrix we find a value of 6.6. Multiplying them gives us a value of 59.4
Q6. Define statistical process control.
ANS: Statistical process control (SPC) is a statistical method of separating variation resulting from special causes from variation resulting from natural causes in order to eliminate the special causes and to establish and maintain consistency in the process, enabling process improvement.
Q7. Explain control charts for variables, with a simple mathematical example.
ANS: Just as there must be many different processes, so must there be many types of control charts. It is important, as the first step in developing your control chart, to select the chart type that is appropriate for your data. The specific steps in developing control charts are different for variables data than for attributes data. Consider an example using x -charts and R -charts. These charts are individual, directly related graphs plotting the mean (average) of samples (x) over time and the variation in each sample (R) over time. The basic steps for developing a control chart for data with measured values are these:
-
Determine sampling procedure. Sample size may depend on the kind of product, production rate, measurement expense, and likely ability to reveal changes in the process. Sample measurements are taken in subgroups of a specific size (n), typically from 3 to 10. Sampling frequency should be often enough that changes in the process are not missed but not so often as to mask slow drifts. If the object is to set up control charts for a new process, the number of subgroups for the initial calculations should be 25 or more. For existing processes that appear stable, that number can be reduced to 10 or so, and sample size (n) can be smaller, say, 3 to 5.
-
Collect initial data of 100 or so individual data points in k subgroups of nmeasurements.
-
The process must not be tinkered with during this time—let it run.
-
Don’t use old data—they may be irrelevant to the current process.
-
Take notes on anything that may have significance.
-
Log data on a data sheet designed for control chart use.
-
Calculate the mean (average) values of the data in each subgroup x.
-
Calculate the data range for each subgroup (R).
-
Calculate the average of the subgroup averages x. This is the process averageand will be the centerline for the x -chart.
-
Calculate the average of the subgroup ranges R. This will be the centerline for the R -chart.
-
Calculate the process upper and lower control limits, UCL and LCL respectively. UCL and LCL represent the ±3σ limits of the process averagesand are drawn as dashed lines on the control charts.
-
Draw the control chart to fit the calculated values.
-
Plot the data on the chart.
Q8. Explain control charts for attributes, with a simple mathematical example.
ANS: p-Chart. Attributes data are concerned not with measurement but with something that can be counted. For example, the number of defects is attributes data. Whereas the x – and R -charts are used for certain kinds of variables data, where measurement is involved, the p -chart is used for certain attributes data. Actually, the p -chart is used when the data are the fraction defective of some set of process output. It may also be shown as percentage defective. The points plotted on a p -chart are the fraction (or percentage) of defective pieces found in the sample of n pieces.
Q9. Discuss and explain various continual quality improvement methods and tools.
ANS: Control charts of all types are fundamental tools for continual improvement. They provide alerts when special causes are at work in the process, and they prompt investigation and correction. When the initial special causes have been removed and the data stay between the control limits (within ±3σ), work can begin on process improvement. As process improvements are implemented, the control charts will either ratify the improvement or reveal that the anticipated results were not achieved. Whether the anticipated results were achieved is virtually impossible to know unless the process is under control. This is because there are special causes affecting the process; hence, one never knows whether the change made to the process was responsible for any subsequent shift in the data or if it was caused by something else entirely. However, once the process is in statistical control, any change you put into it can be linked directly to any shift in the subsequent data. You find out quickly what works and what doesn’t. Keep the favorable changes, and discard the others.
Q10. Explain the way control charts could be used for quality improvements.
ANS: Continual improvement is fundamental to success in the global marketplace. A company that is just maintaining the status quo in such key areas as quality, new product development, adoption of new technologies, and process performance is like a runner who is standing still in a race. Competing in the global marketplace is like competing in the Olympics. Last year’s records are sure to be broken this year. Athletes who don’t improve continually are not likely to remain long in the winner’s circle. The same is true of companies that must compete globally.
Customer needs are not static; they change continually. A special product feature that is considered innovative today will be considered just routine tomorrow. A product cost that is considered a bargain today will be too high to compete tomorrow. A good case in point in this regard is the ever-falling price for each new feature introduced in the personal computer. The only way a company can hope to compete in the modern marketplace is to improve continually.
SOCIAL NETWORKING ARTICLES SUMMARY:
Executive Summary 1: Before I knew I wanted to be a stylist, I sold shoes at the mall. Here's what I learned
Rachel Zoe, was 16 and longed for turning into a specialist and landed into her first position as a business partner at Nine West store in Short Hills Mall in New Jersey. She connected for somewhat monetary opportunity from her guardians and a to interface with new individuals, this transformed her into being a beautician. She was a focused in offering and had a fabulous time doing her occupation well subsequent to the clients were upbeat and will be energized at their buys appeared by Rachel. While working at Nine West, Rachel immediately took in the estimations of relationship building abilities which made her more enthusiastic for buckling down. Rachel got the most accommodating guidance amid her work that the client is constantly right and that you're giving an administration, so be decent! Obliging individuals' needs, understanding their insecurities and adjusting your administrations appropriately came really simple for her. Acing the specialty of interpersonal cooperation made her the top vender in the store and that aptitude has stayed essential all through her profession as a beautician, manager, and fashioner. She was not intrigued to proceed with her future in fund since offering was simple for yet preparing clients at the checkout was unsuccessful. Presently she runs her own particular organization and is looking forward for persons to go along with her outline, article, and styling divisions. Rachel educates that even without regarding part of experience, a great hard working attitude, energy and craving to take in makes one emerge from others.
Moodle Link :
Executive Summary 2: NetSuite Acquires IQity’s Cloud Business, Extends Cloud ERP
Today, NetSuite declared its securing of IQity's Cloud Business arrangement, making a solitary cloud programming framework that embodies different business operations and can bolster both discrete and cluster process producers. NetSuite and IQity report about 40 joint clients, and the consolidated arrangement means to supplant generally separated frameworks and help makers increase better control of production network forms and diminish working expenses. IQity joined NetSuite's Suite Cloud Developer Network as a suit accomplice in 2012 and made the IQity Advanced Manufacturing SuiteApp, which offers components, for example, asset scope quantification, quality administration, and information accumulation abilities for following creation results, hardware utilize, and work profitability. The IQity Advanced Manufacturing SuiteApp was locally based on the NetSuite stage and got the "Worked for NetSuite" affirmation.
Moodle Link :
Executive Summary 3: Ford Motor Co. Invests In South African Operations
Ford Motor Co. will contribute 2.5 billion rand ($166.47 million) in its South African operations to begin generation of the Everest sport utility vehicle and make around 1,200 employments.
The organization's plant in the capital city of Pretoria will have ability to manufacture 10,000 Everests for every year and will be the fourth creation center point for the SUV after processing plants in Thailand, India and China, as per Ford. The automaker arrangements to begin creating the Everest in South Africa in the second from last quarter, and the vehicles will be sold crosswise over sub-Saharan Africa.
"At the point when your plant gets another vehicle, it's a major ordeal," Jim Farley, Ford's leader of Europe, Middle East and Africa, said in a presentation at the processing plant on Tuesday. "Today we are exhibiting our dedication to South Africa and Africa as a long haul key fare base for the Ford Motor Company."
The South African government's car motivating force program has pulled in organizations including Ford, BMW AG, and Volkswagen AG to set up industrial facilities and make employments in the nation, where unemployment is very nearly 25%. Fares of all autos and business vehicles will likely achieve a record of 376,000 units this year, as per the National Association of Automobile Manufacturers of South Africa, even as the neighborhood market decays. Automakers are likewise planning for a normal ascent sought after in sub-Saharan Africa, supported by enhanced street conditions and youthful populaces with discretionary cashflow.
Moodle Link: